A Closer Look at Activation
04 June, 2018
In this analysis we’ll explore the activation metric. A user is considered to be activation if he or she creates at least one update within 14 days of signing up for Buffer. We’ll determine what the activation rates have been historically for new users, and we’ll analyze how long it takes users to activate. We will look at activation rates by signup source, and look into some of the users that never did create that first update.
These are the key findings of the analysis:
- Around 40% of users that signed up in the past year activated.
- The activation rate decreased around August/September 2017 and has remained relatively constant since then.
- The activation rate is highest for those that sign up with Twitter and lowest for those that sign up with Google Plus.
- Of users that didn’t activate and didn’t sign up with a social profile, only 39% ever connected a profile.
- We may make a big impact by helping users complete that first step of connecting a profile in our onboarding.
Alright, let’s collect some data.
Data Collection
We’ll look at all users that signed up in the past year. We’ll exclude users that signed up on Christmas day because there were so many spam accounts.
select
  u.id as user_id
  , date(u.created_at) as signup_date
  , date(date_trunc('week', u.created_at)) as signup_week
  , nullif(split_part(full_scope, ' ', 2), '') as signup_option
  , count(distinct p.id) as profiles
  , date(min(up.created_at)) as first_update_date
from dbt.users as u
left join dbt.profiles as p
  on u.id = p.user_id
left join dbt.updates as up
  on up.user_id = u.id and up.was_sent_with_buffer
left join actions_taken as a
  on a.user_id = u.id and nullif(split_part(a.full_scope, ' ', 1), '') = 'signup'
where u.created_at > (current_date - 365)
and u.created_at < (current_date - 15)
group by 1, 2, 3, 4
Great. Now let’s determine if the users activated.
# determine if users activated
users <- users %>%
  filter(signup_date != '2017-12-25') %>%
  mutate(activated = ifelse(is.na(first_update_date), F,
                            ifelse(as.numeric(first_update_date - signup_date) <= 14, T, F)))
Let’s look at the overall activation rate.
users %>%
  filter(signup_date != '2017-12-25') %>%
  group_by(activated) %>%
  summarise(users = n_distinct(user_id)) %>%
  mutate(percent = users / sum(users))
## # A tibble: 2 x 3
##   activated  users percent
##   <lgl>      <int>   <dbl>
## 1 F         901412   0.595
## 2 T         614590   0.405
Around 40% of all users created an update within 14 days of signing up for Buffer. Now let’s see how this rate has changed over time.
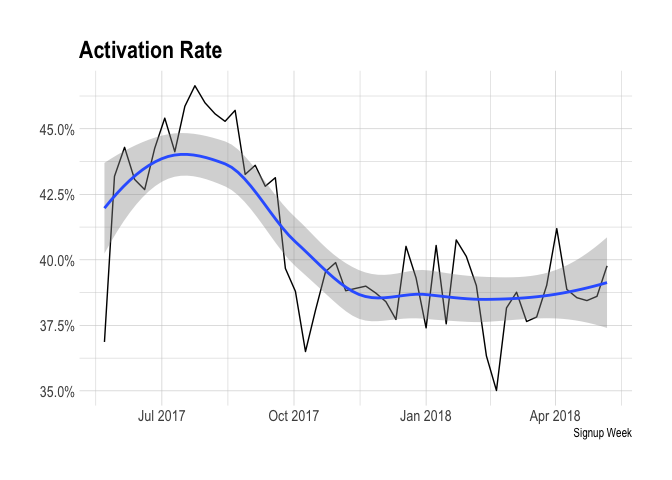
It seems like the activation rate decreased somewhat around September 2017 and has remained fairly constant since them. Let’s now break the activation rate down by the signup source.
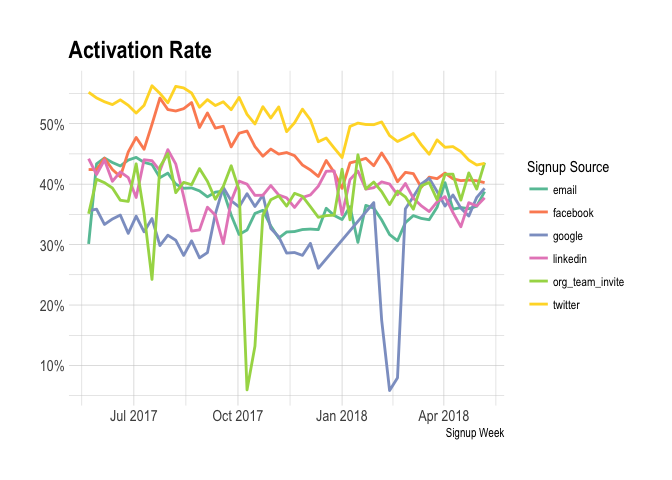
We can see that there are some differences in the activation rates for users that signed up with different options. Those that sign up with Twitter activate at the highest rate, while those that signup with Google activate at a lower rate.
Let’s create a bar plot to view the overall activation rates for each signup source.
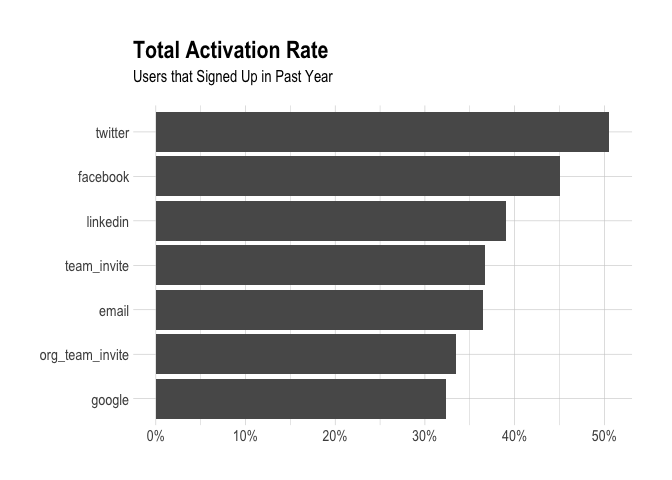
It’s interesting to see these activation rates. Those users that sign up with Twitter activate at the highest rate. Perhaps that is because the barrier to creating that first post is so low on Twitter. For those that sign up via email or team invite, the extra step of connecting a profile is required. Now let’s take a closer look at users that did not activate.
Inactivated
We want to know what proportion of these users even connected a profile.
# get proportion that connected profile
users %>%
  filter(!activated) %>%
  mutate(has_profile = profiles >= 1) %>%
  group_by(has_profile) %>%
  summarise(users = n_distinct(user_id)) %>%
  mutate(percent = users / sum(users))
## # A tibble: 2 x 3
##   has_profile  users percent
##   <lgl>        <int>   <dbl>
## 1 F           349922   0.388
## 2 T           551490   0.612
Only around 61% of users that didn’t activate had a profile connected. Many of these users signed up with a social account. Let’s only look at users that signed up via email.
# get proportion that connected profile
users %>%
  filter(!activated & signup_option == 'email') %>%
  mutate(has_profile = profiles >= 1) %>%
  group_by(has_profile) %>%
  summarise(users = n_distinct(user_id)) %>%
  mutate(percent = users / sum(users))
## # A tibble: 2 x 3
##   has_profile  users percent
##   <lgl>        <int>   <dbl>
## 1 F           251328   0.602
## 2 T           166180   0.398
Of those that signed up with email, only 39% even connected a profile! We may be able to help increase this rate with our onboarding flow.