Distribution of Customers Over Time
We recently received this great question from the Finance team: “I was curious if you might be able to help me figure out our most recent 6 months distribution (# of customers) with Pro, Small, Medium and Enterprise plans.”
We can answer this question with data in the subscription_mrr_values table. The only tricky part will be categorizing the subscriptions into these categories. First thing’s first, let’s collect the MRR values from the past six months.
We’ll only collect data from Stripe and will assume that the distribution of customers in mobile is similar. In any case, there are far more customers paying via Stripe, so this should give us a good idea of the overall distribution.
select
  date(s.date) as report_date
  , s.plan_id
  , p.simplified_plan_id
  , count(distinct s.customer_id) as customers
  , sum(s.mrr_amount) as total_mrr
from dbt.stripe_mrr as s
left join dbt.plans as p on s.plan_id = p.id
where s.date >= (current_date - 181)
group by 1, 2, 3
Awesome. Now we need to categorize the plans into these categories: Pro, Small, Medium, Enterprise. Let’s get a sense of all the plan IDs we’re working with here.
# get plan counts
table(subscriptions$plan_id)
##
##                    40TeamMembers                           50team
##                              182                              182
##                 60TeamMembers_v2                   70TeamMemberv1
##                               64                              127
##                 75 TM v1 Monthly              80TeamMembersYearly
##                               17                               96
##         85 Team Member Custom v1                    agency-yearly
##                              165                              182
## analyze-early-access-10-profiles analyze-early-access-25-profiles
##                               86                               85
## analyze-early-access-50-profiles                         business
##                               71                              182
##       business_v2_agency_monthly        business_v2_agency_yearly
##                              182                              182
##     business_v2_business_monthly      business_v2_business_yearly
##                              182                              182
##        business_v2_small_monthly         business_v2_small_yearly
##                              182                              182
##                  business-simple                  business-yearly
##                              182                              182
##                       Ent300Prof             Enterprise 100 users
##                              182                              182
##           Enterprise 175 monthly           Enterprise 200 Yearly2
##                               59                              182
##  Enterprise 30 Members V2 Annual       Enterprise 35 Team Members
##                              182                              182
##     Enterprise 400 + 60 Users v2        Enterprise 400 v2 monthly
##                              118                              182
##       Enterprise 50 team members    Enterprise 50 team members v1
##                               39                               59
##        Enterprise 500 v2 monthly    Enterprise 60 team members v1
##                              182                               31
##   Enterprise 900 social accounts                     Enterprise-2
##                               29                              182
##                   enterprise-500         Enterprise100TeamMembers
##                               20                              169
##             Enterprise150-40team                  Enterprise200v2
##                              182                              182
##                    Enterprise250                 enterprise250+50
##                               90                              169
##                     enterprise30                    enterprise300
##                              182                              182
##                 Enterprise300_v2                   enterprise30v2
##                              129                              182
##                    Enterprise400              enterprise500yearly
##                              182                              177
##                   Enterprise90v1                          lite-29
##                               85                              182
##                         plus-149                         plus-349
##                              182                              182
##                   premium-annual                   pro_v1_monthly
##                              181                               55
##                    pro_v1_yearly                       pro-annual
##                               55                              182
##                      pro-monthly                    Respond-12-12
##                              182                              180
##    respond-business-base-monthly          respond-channel-monthly
##                              182                              182
##             respond-grow-monthly                Respond-Medium-v2
##                              182                              182
##            respond-medium-yearly            respond-pro-annual-v1
##                              182                              182
##         respond-pro-base-monthly          respond-pro-base-yearly
##                              182                              182
##              respond-pro-monthly            Respond-Small-Team-v2
##                              182                              182
##            Respond-Small-Team-v3       respond-standard-v2-yearly
##                              182                               23
##         Respond-starter-annual-1          respond-starter-monthly
##                              182                              182
##       respond-starter-monthly-v2             respond-user-monthly
##                              182                              182
##              respond-user-yearly                   small_business
##                              182                              182
##            small_business_yearly                        small-149
##                              182                              182
##                         small-29                           solo-9
##                              182                              182
##                        studio-29                        studio-59
##                              182                              182
Wow, there are a lot. Let’s start with low hanging fruit, Awesome/Pro, Reply, and Analyze plans.
# set new plan field
subscriptions <- subscriptions %>%
  mutate(plan_type = ifelse(simplified_plan_id == 'reply', 'Reply',
                       ifelse(simplified_plan_id == 'awesome', 'Awesome/Pro',
                         ifelse(simplified_plan_id == 'analyze', 'Analyze', NA))))
Now let’s see how many we’ve categorized.
table(subscriptions$plan_type)
##
##     Analyze Awesome/Pro       Reply
##         242         474        4571
Ok, now let’s take care of Small Business.
# set small business
subscriptions <- subscriptions %>%
  mutate(plan_type = ifelse(is.na(plan_type) & grepl('small', plan_id), 'Small Business', plan_type))
Great. Let’s view the plan IDs we still need to categorize.
# count uncategorized plan IDs
subscriptions %>%
  filter(is.na(plan_type)) %>%
  count(plan_id) %>%
  arrange(desc(n))
## # A tibble: 43 x 2
##    plan_id                          n
##    <chr>                        <int>
##  1 40TeamMembers                  182
##  2 50team                         182
##  3 agency-yearly                  182
##  4 business                       182
##  5 business_v2_agency_monthly     182
##  6 business_v2_agency_yearly      182
##  7 business_v2_business_monthly   182
##  8 business_v2_business_yearly    182
##  9 business-simple                182
## 10 business-yearly                182
## # ... with 33 more rows
Great. Let’s take care of medium business. The rest will be enterprise plans!
# list medium business plan names
med_plans <- c('business', 'business-yearly', 'business_v2_business_monthly',
               'business_v2_business_yearly')


# categorize medium business and enterprise plans
subscriptions <- subscriptions %>%
  mutate(plan_type = ifelse(is.na(plan_type) & plan_id %in% med_plans, 'Medium Business',
                     ifelse(is.na(plan_type) & !(plan_id %in% med_plans), 'Enterprise', plan_type)))
Let’s view the categorized plans now.
table(subscriptions$plan_type)
##
##         Analyze     Awesome/Pro      Enterprise Medium Business
##             242             474            5464             728
##           Reply  Small Business
##            4571             728
Perfect!
Visualizing the Distribution of Customers over Time
Let’s start by creating a stacked area chart that shows the distribution of all customers over time.
## Warning in as.POSIXlt.POSIXct(x): unknown timezone 'zone/tz/2018c.1.0/
## zoneinfo/America/Kentucky/Louisville'
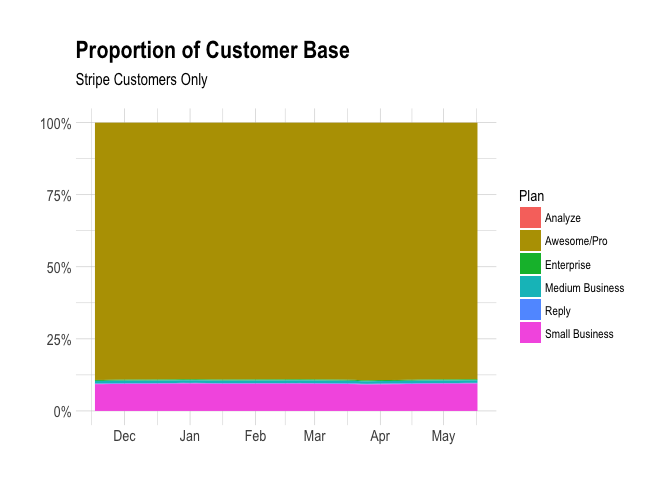
It’s difficult to see changes over time here, so let’s plot each plan type individually.
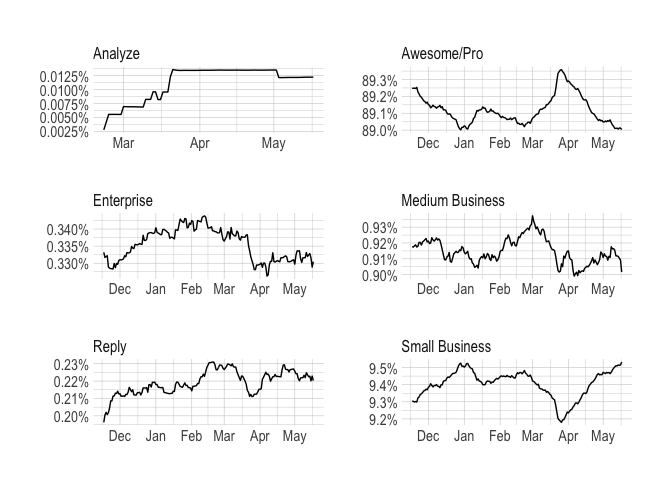
We can see that there hasn’t been much change in the past six months. Awesome/Pro subscriptions make up around 89% of the customer base, Small Business subscriptions make up around 9.5% of the customer base, Medium Business makes up 0.9%, Enterprise makes up 0.3%, Reply 0.2%, and analyze a negligible amount.