Time to Activate
07 August, 2018
In this analysis we’ll look at how long it takes new Buffer users to create their first update. We’ll collect the data from Redshift with the query below.
Data Collection
select
  u.id as user_id
  , u.created_at as signup_at
  , uf.first_update_created_at
  , datediff(day, u.created_at, uf.first_update_created_at)
from dbt.users as u
left join dbt.user_update_facts as uf
on uf.user_id = u.id
where u.created_at >= '2018-01-01'
and u.created_at <= '2018-06-01'
Great. There are around 85K users to work with. Now let’s filter out users that weren’t in the experiment.
# set integer values
users$date_diff <- as.integer(users$date_diff)

# set signup date as a date object
users$signup_at <- as.Date(users$signup_at, format = "%Y-%m-%d")
users$first_update_created_at <- as.Date(users$first_update_created_at, format = "%Y-%m-%d")
There are 676K users in this sample. Around 269k users activated at some point.
Exploratory Analysis
Let’s plot the distribution of the number of days it takes users to create their first update in Buffer.
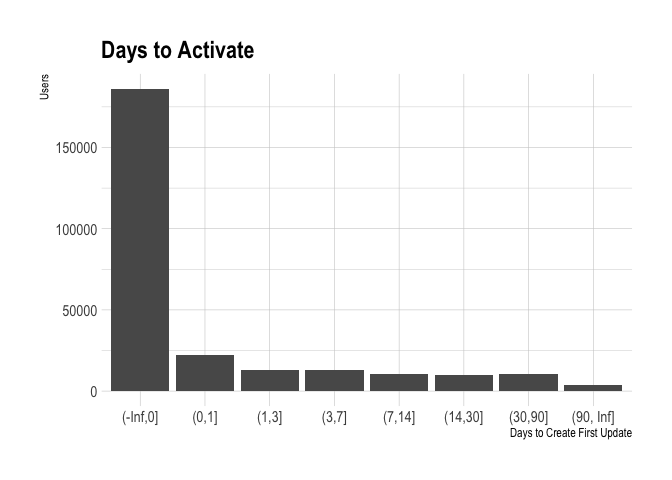
We can see there that the vast majority of users that activated did so on the first day of signing up for Buffer. Let’s look at how activation rates would differ if we were to define “activated” as having created an update within 1, 3, 5, 7, 14, and 30 days.
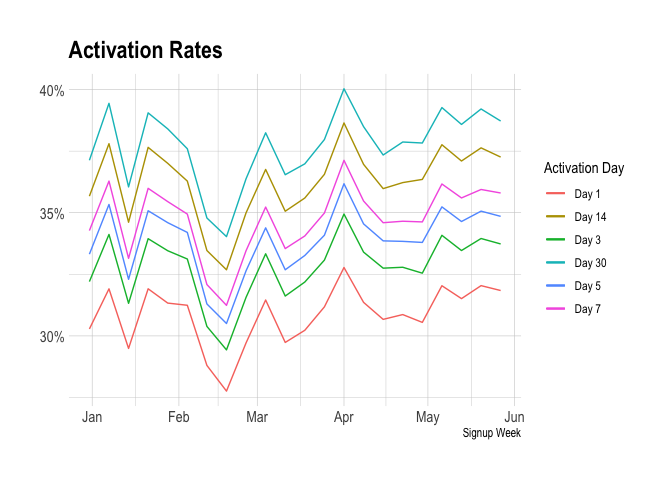
We can see here that the differences are quite small between which day we choose. If we chose to measure the percentage of users that activated in 1 day, the activation rate would be around 31%. We we chose 3 days, the activation rate would be around 33%. If we chose 5 days, it’d be around 34%. If we chose 7 days, it’d be around 35%. If we chose 14 days, it’d be around 36%. If we chose 30 days, it’d be around 38%.
Based on this data, I’d suggest that we go with 3 days.